Good News and Bad News
Presentation to the Catholic Physicians' Guild of Vancouver
North
Vancouver B.C.,
22 November, 2014
Full Text

Appendix "A"
A1. Belgium
The Belgian Act on Euthanasia of May 28th, 2002
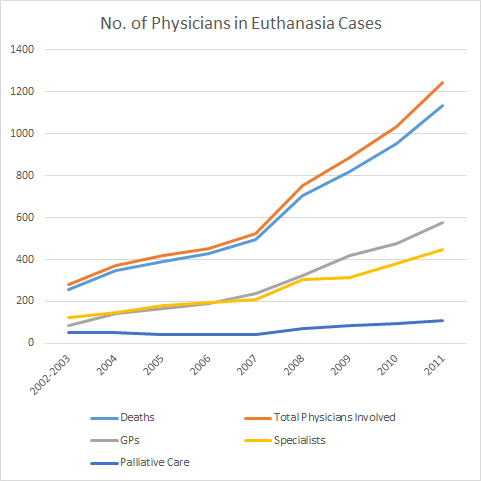
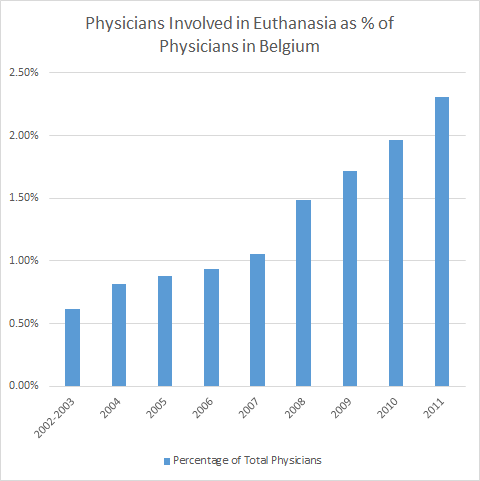
Euthanasia was legalized in Belgium in 2002. The following statistics
refer only to reported euthanasia cases. The statistics here indicate the
maximum number of physicians involved in reported cases each year, not the
actual number of physicians participating.
|
|
First Consultant |
Second Consultant |
Totals |
|
Year |
Deaths |
Palliative Care |
GPs |
Specialists |
Unspec. |
Psychiatrist |
Specialist |
1st |
2nd |
1st & 2nd |
|
2002-2003 |
259 |
51 |
84 |
124 |
0 |
15 |
7 |
259 |
22 |
281 |
|
2004 |
349 |
53 |
143 |
147 |
6 |
10 |
14 |
349 |
24 |
373 |
|
2005 |
393 |
42 |
166 |
183 |
2 |
18 |
9 |
393 |
27 |
420 |
|
2006 |
429 |
43 |
190 |
195 |
1 |
15 |
11 |
429 |
26 |
455 |
|
2007 |
495 |
43 |
238 |
211 |
3 |
19 |
9 |
495 |
28 |
523 |
|
2008 |
704 |
71 |
326 |
307 |
0 |
38 |
11 |
704 |
49 |
753 |
|
2009 |
822 |
85 |
420 |
315 |
2 |
41 |
26 |
822 |
67 |
889 |
|
2010 |
953 |
97 |
475 |
381 |
0 |
55 |
25 |
953 |
80 |
1033 |
|
2011 |
1133 |
109 |
575 |
449 |
0 |
78 |
36 |
1133 |
114 |
1247 |
Sources: Commission Fédérale de
Contrôle et d'Évaluation de l'Euthanasie Annual Reports
| Year |
Deaths |
Physicians
Involved |
Physicians/100,000 |
Population |
Est. Total No.
Physicians |
% of Total |
2002
-2003 |
259 |
281 |
437.3 |
10,355,844
|
45,286 |
0.62% |
|
2004 |
349 |
373 |
441.3 |
10,396,421 |
45,879 |
0.81% |
|
2005 |
393 |
420 |
458.4 |
10,445,852 |
47,884 |
0.88% |
|
2006 |
429 |
455 |
462.7 |
10,511,382 |
48,636 |
0.94% |
|
2007 |
495 |
523 |
469 |
10,584,534 |
49,641 |
1.05% |
|
2008 |
704 |
753 |
474.7 |
10,666,866 |
50,636 |
1.49% |
|
2009 |
822 |
889 |
480.9 |
10,753,080 |
51,712 |
1.72% |
|
2010 |
953 |
1033 |
485.5 |
10,839,905 |
52,628 |
1.96% |
|
2011 |
1133 |
1247 |
491.1 |
11,000,638 |
54,024 |
2.31% |
Sources:
Commission Fédérale de Contrôle et d'Évaluation de
l'Euthanasie Annual Reports; Eurostat:
Licensed Physicians Per 100,000 Inhabitants; Eurostat:
Population on 1 January- Belgium (Accessed 2014-07-16)
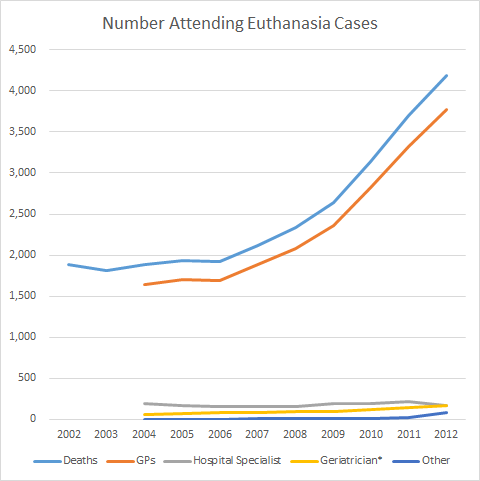
A2. Netherlands
Termination of Life on Request and Assisted Suicide (Review Procedures)
Act
Euthanasia and assisted suicide were legalized in the
Netherlands in 2002. The following statistics refer only
to reported euthanasia and assisted suicide cases. The
statistics here indicate the maximum number of
physicians involved in reported cases each year, not the
actual number of physicians participating.
| |
Deaths |
Attending Physician |
| Year |
Total |
Euthanasia |
A.
Suicide |
Combined |
GP |
Hospital Specialist |
Geriatrician* |
Other |
Total |
|
2002 |
1,882 |
|
|
|
|
|
|
|
|
|
2003 |
1,815 |
1,626 |
148 |
41 |
|
|
|
|
|
|
2004 |
1,886 |
1,714 |
141 |
31 |
1,646 |
188 |
52 |
0 |
1,886 |
|
2005 |
1,933 |
1,765 |
143 |
25 |
1,697 |
170 |
66 |
0 |
1,933 |
|
2006 |
1,923 |
1,765 |
132 |
26 |
1,692 |
151 |
80 |
0 |
1,923 |
|
2007 |
2,120 |
1,923 |
167 |
30 |
1,886 |
157 |
76 |
1 |
2,120 |
|
2008 |
2,331 |
2,146 |
152 |
33 |
2,083 |
152 |
91 |
5 |
2,331 |
|
2009 |
2,636 |
2,443 |
156 |
37 |
2,356 |
184 |
87 |
10 |
2,637 |
|
2010 |
3,136 |
2,910 |
182 |
44 |
2,819 |
193 |
115 |
9 |
3,136 |
|
2011 |
3,695 |
3,446 |
196 |
53 |
3,329 |
212 |
139 |
15 |
3,695 |
|
2012 |
4,188 |
3,965 |
185 |
38 |
3,777 |
171 |
166 |
74 |
4,188 |
Sources: Regional Euthanasia Review
Committees Annual Reports. Note: *Includes
physicians working in nursing homes.
| |
|
Total in
Netherlands/Category |
Percentage of Totals,
Categories & Overall |
| Year |
Deaths |
GP |
Med. Spec. |
Physicians |
%GP |
%HS |
% Geriatric |
%Other |
%Overall |
|
2004 |
1,886 |
7,960 |
11,275 |
19,235 |
20.68% |
1.67% |
0.46% |
0.00% |
9.81% |
|
2005 |
1,933 |
8,165 |
12,305 |
20,470 |
20.78% |
1.38% |
0.54% |
0.00% |
9.44% |
|
2006 |
1,923 |
8,450 |
12,850 |
21,300 |
20.02% |
1.18% |
0.62% |
0.00% |
9.03% |
|
2007 |
2,120 |
9,130 |
14,080 |
23,210 |
20.66% |
1.12% |
0.54% |
0.01% |
9.13% |
|
2008 |
2,331 |
9,350 |
14,485 |
23,835 |
22.28% |
1.05% |
0.63% |
0.03% |
9.78% |
|
2009 |
2,636 |
9,660 |
15,020 |
24,680 |
24.39% |
1.23% |
0.58% |
0.07% |
10.68% |
|
2010 |
3,136 |
9,960 |
16,055 |
26,015 |
28.30% |
1.20% |
0.72% |
0.06% |
12.05% |
Sources: Regional Euthanasia Review
Committees Annual Reports; Statistics Netherlands:
Health, lifestyle, health care use and supply, causes of death; from 1900.
Subjects:
Care Supply, Health Professions. (Accessed 2014-07-16)
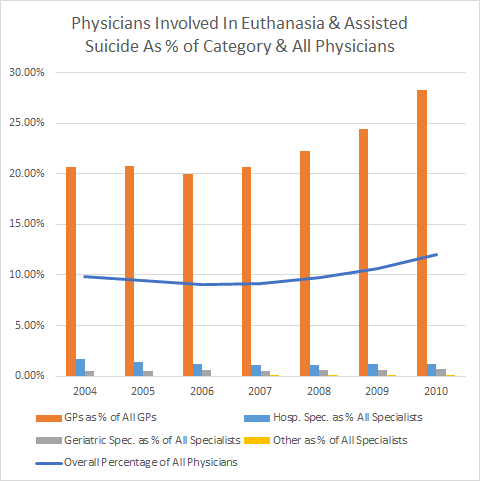
Note: percentages of hospital and
geriatric specialists and "other" is relative to the total number of medical
specialists. Overall percentage is in relation to total number of
physicians.
A3. Oregon
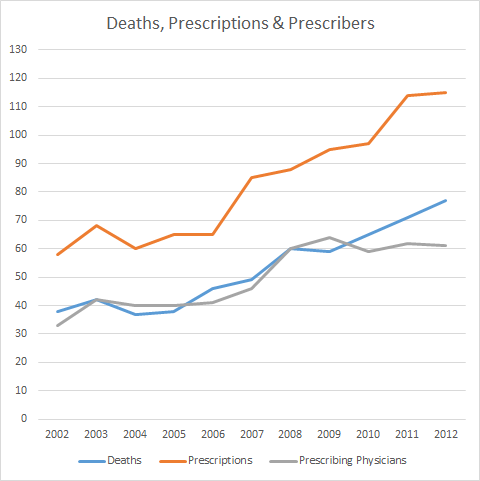
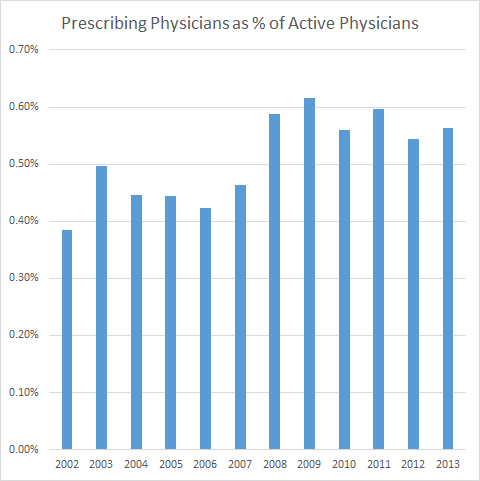
Death With Dignity Act: Physician Prescribers
Physician assisted suicide was legalized in Oregon in 1997.
| Year |
Deaths |
Prescriptions |
Prescribing
Physicians |
Active MDs |
% of Active MDs |
|
2002 |
38 |
58 |
33 |
8,596
|
0.38% |
|
2003 |
42 |
68 |
42 |
8,469
|
0.50% |
|
2004 |
37 |
60 |
40 |
8,986
|
0.45% |
|
2005 |
38 |
65 |
40 |
8,997
|
0.44% |
|
2006 |
46 |
65 |
41 |
9,691
|
0.42% |
|
2007 |
49 |
85 |
46 |
9,915
|
0.46% |
|
2008 |
60 |
88 |
60 |
10,211 |
0.59% |
|
2009 |
59 |
95 |
64 |
10,389 |
0.62% |
|
2010 |
65 |
97 |
59 |
10,546 |
0.56% |
|
2011 |
71 |
114 |
62 |
10,389 |
0.60% |
|
2012 |
77 |
115 |
61 |
11,203 |
0.54% |
|
2013 |
71 |
122 |
62 |
11,005 |
0.56% |
Sources: Oregon Public Health
Division, 2013 Death with Dignity Act Report: Prescription History;
Oregon Medical Board Reports.
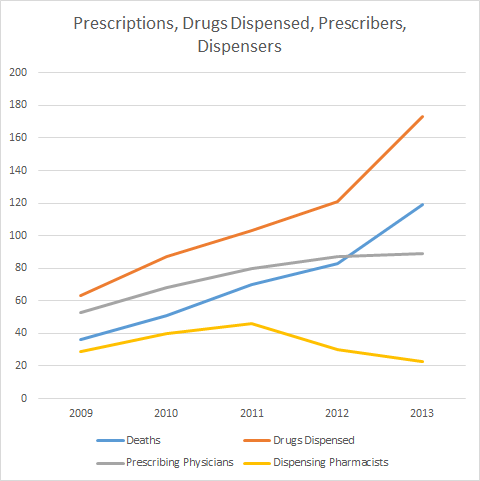
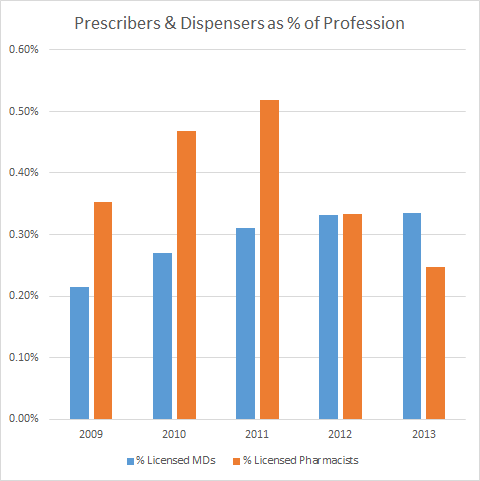
A4. Washington State
Death With Dignity Act: Physician Prescribers, Pharmacist Dispensers
Physician assisted suicide was legalized in the state of Washington in
2009.
| Year |
Deaths |
Drugs Dispensed |
Prescribing Physicians |
Dispensing Pharmacists |
Licensed MDs |
Licensed Pharmacists |
% Licensed MDs |
% Licensed Pharmacists |
|
2009 |
36 |
63 |
53 |
29 |
24,670 |
8,216 |
0.21% |
0.35% |
|
2010 |
51 |
87 |
68 |
40 |
25,135 |
8,556 |
0.27% |
0.47% |
|
2011 |
70 |
103 |
80 |
46 |
25,783 |
8,861 |
0.31% |
0.52% |
|
2012 |
83 |
121 |
87 |
30 |
26,167 |
8,983 |
0.33% |
0.33% |
|
2013 |
119 |
173 |
89 |
23 |
26,536 |
9,289 |
0.34% |
0.25% |
Sources: Washington State Department
of Health, Death With dignity Act Reports; Washington State
Department of Health, Health Systems Quality Assurance, Health
Professions Discipline and Regulatory Activities (2009-2011 Biennial Report);
Washington State Department of Health, Health Systems Quality Assurance
Division, 2011-2013 Uniform Disciplinary Act Biennial Report.
